August 22, 2026
Comparing Analytical Purity Figures
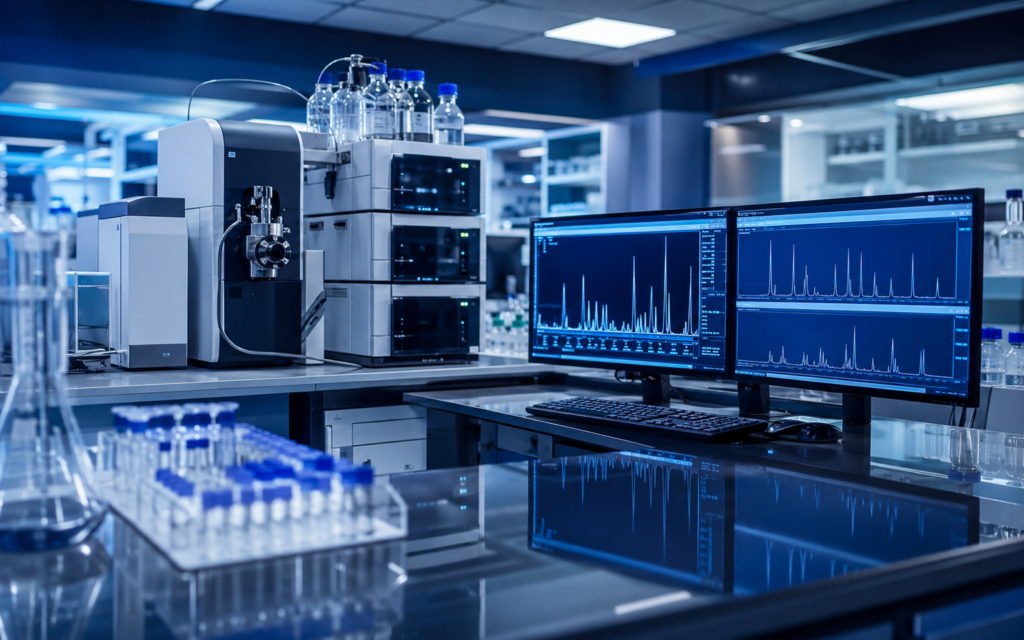
Purity figures are method-dependent
A percentage reported by one analytical method may not describe the same property as a percentage from another method. Review the technique, detector, reference standard, calculation, and reporting basis before comparing numbers.
Check what the percentage represents
Determine whether the figure is based on peak area, mass balance, assay against a standard, or another calculation. Water, salts, counterions, residual solvents, and unmeasured components can affect interpretation.
Compare like with like
Use reports tied to the relevant lots and compare results generated under sufficiently similar conditions. A higher number is not automatically more informative when the underlying methods differ.